Estimated reading time: 4 minutes
Cox Automotive has just released a special edition of the Car Buyer Journey Study, focused on the buying journey during the pandemic. Believe it or not, this consumer survey of recent car buyers shows that in 2020, they were actually more satisfied with their experience than in the past. Let’s dig into why and what we can learn from it.
So, what do consumers think about buying cars during the pandemic?
Satisfaction with the dealership experience is up, way up. For new-car buyers surveyed, satisfaction with the dealership experience was up six percentage points, from 73% in 2019 to 79% this fall. The increase was even greater for used-vehicle buyers, rising from 69% to 76%.*
Why has customer satisfaction among car buyers increased?
The short answer: increased trust in the deal and a more efficient online and in-store experience.
First, trust in the deal is central to customer satisfaction.

The Car Buyer Journey Study, Pandemic Edition reveals that trust in “the deal” improved among new-car and used-car buyers during the pandemic. You can check out the full study for all of the details, including the role that OEM incentives played in the spring. In this post, we’ll focus on the key factor in trust that dealerships have control over, the buying experience.
Digital retailing drives more trust in the deal.
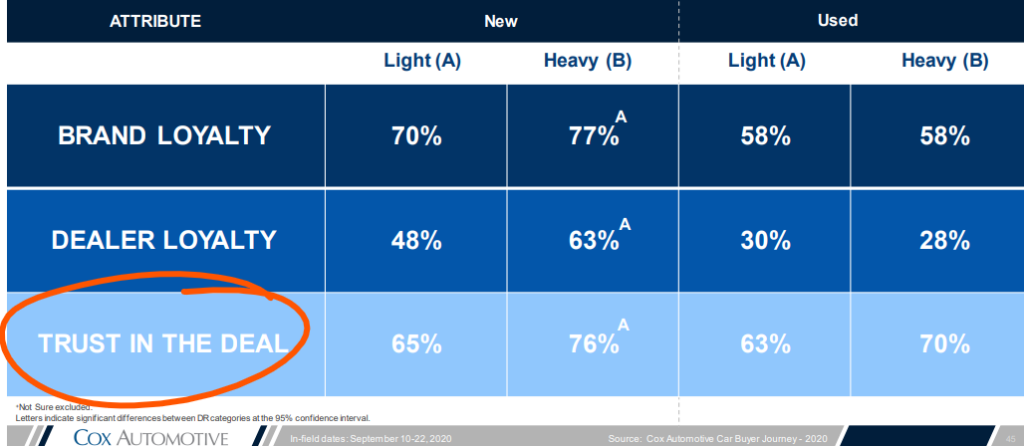
We all know that many potential buyers are looking to get their purchases started online, and offering online steps is key to attracting them to your dealership. But did you know that it also affects buyers’ trust? The study results show that for both new- and used-car buyers, trust in the deal was higher for buyers who did more steps in the buying journey online. As you’ll see in the table below, heavier use of digital retailing (51%+ of steps entirely online v. “light” use of 0%-20% of steps entirely online) resulted in big increases in trust.

And the other big factor was time and efficiency.
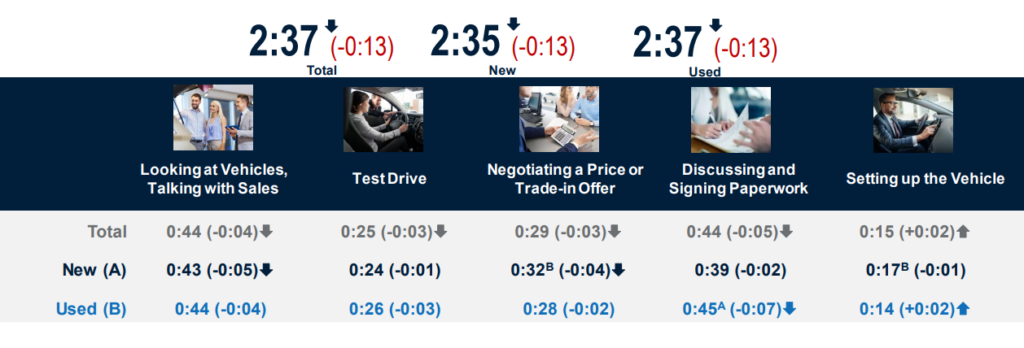
Reported time spent with the dealership decreased in 2020 by 13 minutes for both new-car and used-car purchasers (from an average of 2 hours, 50 minutes to 2 hours, 37 minutes). And guess what? Satisfaction with how long the process took increased by 10% year over year. This is no coincidence.
It comes as no surprise that buyers want a faster, more efficient process and that they’re more satisfied when they get it. Let’s look at where those minutes were saved in 2020.

Did your dealership make changes to shave time off time spent on negotiation, trade-in, and paperwork last year?
This is great progress, but we’ve still got a ways to go. While satisfaction with how long the process took increased by 10% year over year, only 62% of new-car buyers and 56% of used-car buyers said they were satisfied with the time. What additional steps does your dealership have planned to further streamline the buying process in 2021?
Speaking of customer satisfaction. . .
If your dealership has built more trust in the deal and streamlined the buying process during the pandemic, now could be a great time to ensure that happy customers are sharing their experiences. Consider this, one of the “key takeaways” shared in the study:
“Reputation management is crucial and impactful to the bottom line. Capitalize on the fact that customer satisfaction is at an all-time high. Encourage customers to provide reviews of their dealership experience and keep them engaged. Utilize less than favorable reviews to strategize on ways to improve the retail experience.”
– Car Buyer Journey Study, Pandemic Edition
And remember, we’re here to help. Reach out to your local Dealer Success Consultant to discuss tools and strategies for continuing to build trust in the deal and deliver a streamlined buying process that creates satisfied customers.
In our next blog post, we’ll dig into some more details from the Car Buyer Journey Study, Pandemic Edition, focusing on trends in the online buying experience.
*All statistics in this post are from Cox Automotive Car Buyer Journey Study, Pandemic Edition, release date February 1, 2021. Please see the report for full details, including dates of survey results compared for each statistic.

 ';
';


