Estimated reading time: 3 minutes
In previous posts, we outlined simple ways to dive into nVision and start taking action, and how to make sense of the Inventory Age and Pricing tiles to streamline your inventory turn. Today, we’ll move even deeper into nVision and discuss what we call the “Probability to Sell” Matrix. Found within the Analyze Inventory section of nVision, this report will prioritize your to-do list in a single glance. Let’s dive into what you can do with this data.
Four Squares. Countless Actions.
The four quadrants of the Probability to Sell Matrix are actionable tools in and of themselves. This matrix is another way to see both a high-level and micro view of listing performance and recommended actions. Simply put, the matrix categorizes your inventory by likelihood to sell and next steps needed. So, should you invest more in a listing? Or should you put your dollars elsewhere? The nVision Probability to Sell Matrix will help you decide.
Mastering the Four Quadrants
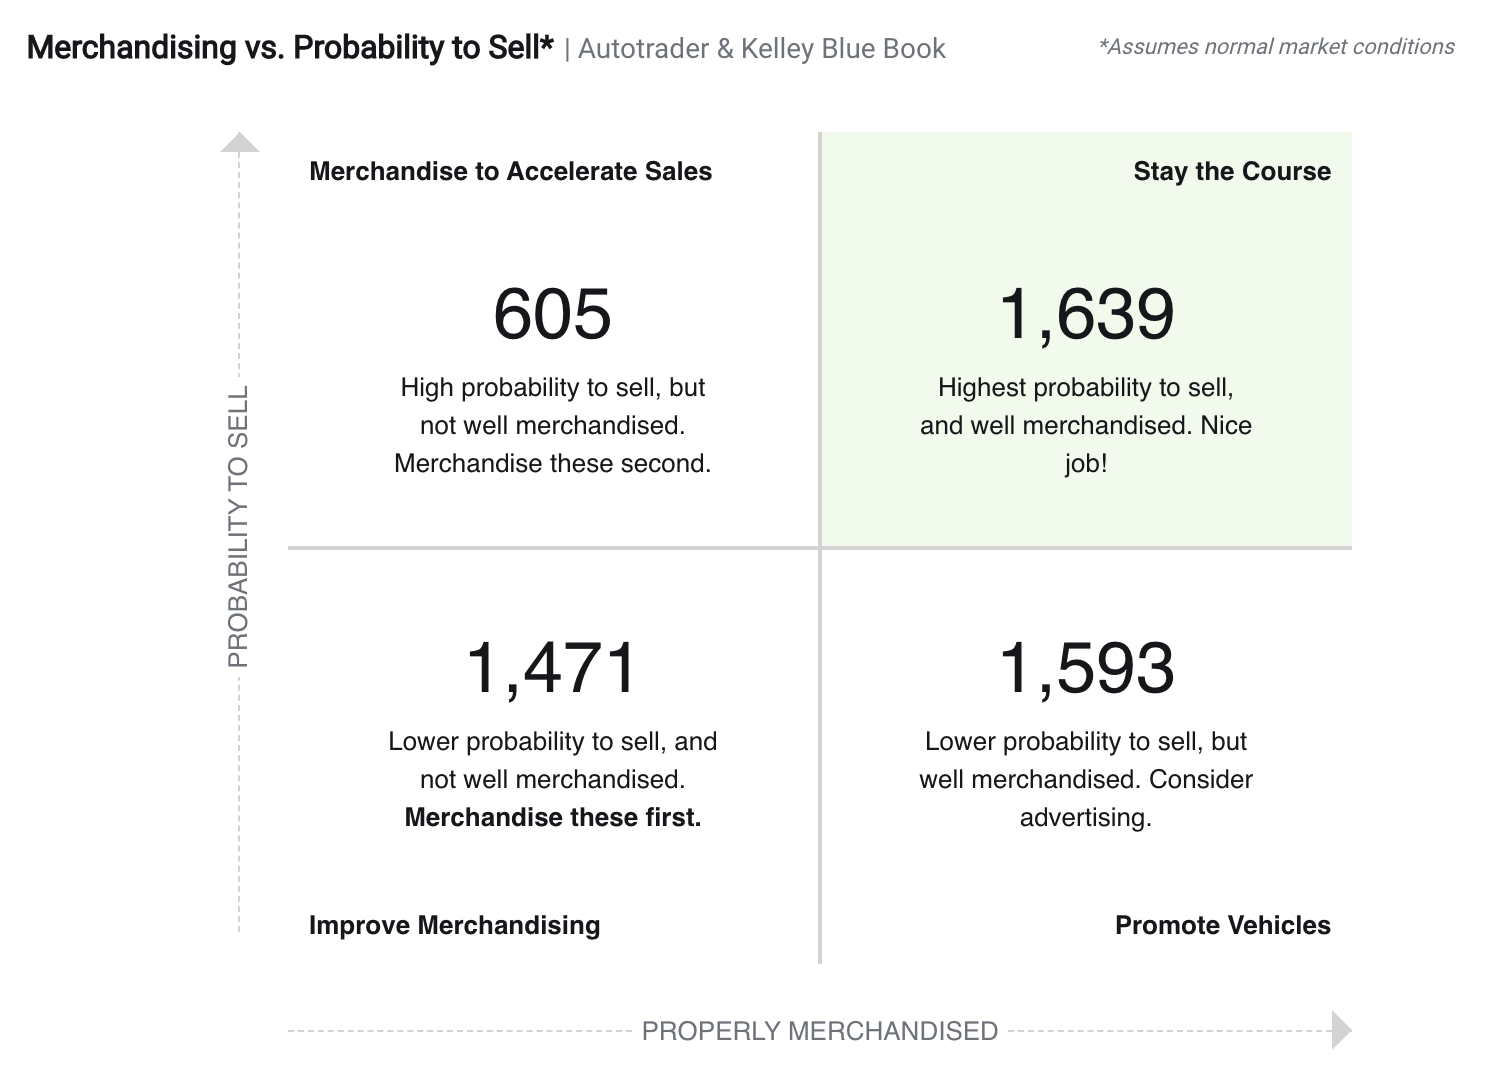
Improve Merchandising: The bottom left quadrant is a great place to start. It lets you know which vehicle listings need more or better vehicle merchandising. Consider this area an “online recon lot” that should ideally should be empty or very low. Vehicles appearing in this quadrant likely haven’t been merchandised at all. Perhaps there’s an operational or staffing delay that’s causing this. Whatever the cause, encourage quick investigation and immediate merchandising to keep this number low.
Promote Vehicles: Next, if you’re looking for answers on whether or not to promote vehicles, check out the lower right quadrant. Boost lower-scoring vehicles with a little extra attention. Consider spotlights or premium listings.
Merchandise to Accelerate Sales: Then, in the upper left quadrant, you’ll discover vehicles you need to merchandise to accelerate sales. These vehicles are in good shape when it comes to market data, listing details and web activity. However, improved merchandising would give them a boost in search results on Autotrader and KBB.com. So, make sure there is no merchandising “low-hanging fruit” that you’re missing out on, such as video, additional custom photos and robust comments.
PRO TIP: The optimum number of custom photos for used-vehicle listings is 25.
Stay the Course: Finally, in the upper right quadrant, you’ll see information on the vehicles for which you should stay the course. In short, the higher the number here, the better. You’ve merchandised these vehicles well. And market data, the listings details and web activity for these vehicles indicate that they’re likely to sell. So, to ensure that they move off the lot as quickly as possible, make sure you can answer these questions for the inventory in this quadrant:
- Is there anything happening offline to keep these vehicles from selling? Is it a loaner? Where is it parked?
- Do you have Spotlights activated for these specific vehicles?
- Are they ready to sell today? Are they gassed up, clean and on the front line?
The Probability to Sell Matrix arms you with the information you need to act.
Now, what are you waiting for? Explore the dashboard to see what the data can do for you right now. Remember, if you don’t yet have access, contact your Dealer Success Consultant today. And come back next week as we go deep into the Analyze Live report, which gives you a transparent and real-time view of what’s happening on your lot.


