Estimated reading time: 3 minutes
We’re excited to introduce nVision, a powerful analytics dashboard included with all Autotrader and KBB.com listings subscriptions. In today’s post, you’ll find out what the tool has to offer and get some tips for getting started.
If you don’t yet have access to nVision, we’re currently rolling out to dealers nationwide, so contact your Dealer Success Consultant to see when you’re scheduled.
Measure and act on the performance and ROI of your Autotrader and KBB.com listings
Data, data, data. You’ve got it, but what does it all mean? More importantly, what on earth do you do with it? Making sense of the statistics can be a challenge, but Autotrader dealers have a powerhouse of a platform at their fingertips. nVision is designed to help improve your listings’ performance. So, let’s stop guessing and start analyzing.
What is nVision?
nVision is a new analytics dashboard that includes reports on your marketing performance across Autotrader and KBB.com. It’s built to help you better understand how well those investments are translating into sales, and then take action. No more pulling from various portals and sources. No more outdated numbers. Just one source of truth and one path to action.
Reporting and analytics that matter, from any device
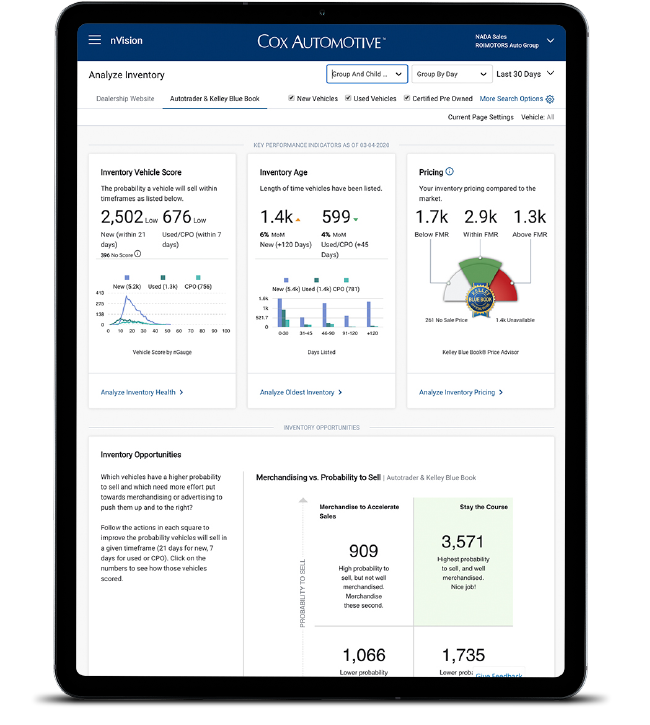
Analyze Inventory report: Get details on how your Autotrader and KBB.com inventory is performing. See simple, actionable ways to get stronger results from your digital showroom.
Analyze Shoppers report: Understand how your digital-marketing and advertising investments are influencing shoppers and buyers.
Analyze Live report: See up-to-the-minute shopper activity and real-time snapshots of vehicle views. (If you’ve used Autotrader’s Connections App in the past, the Analyze Live report offers similar data, now accessible from any device.)
Tips for getting started
In upcoming blog posts, we’ll walk you through what each of the three reports can do for you. But first, let’s concentrate on some simple first steps with the A-B-C approach.
A: Alerts for action
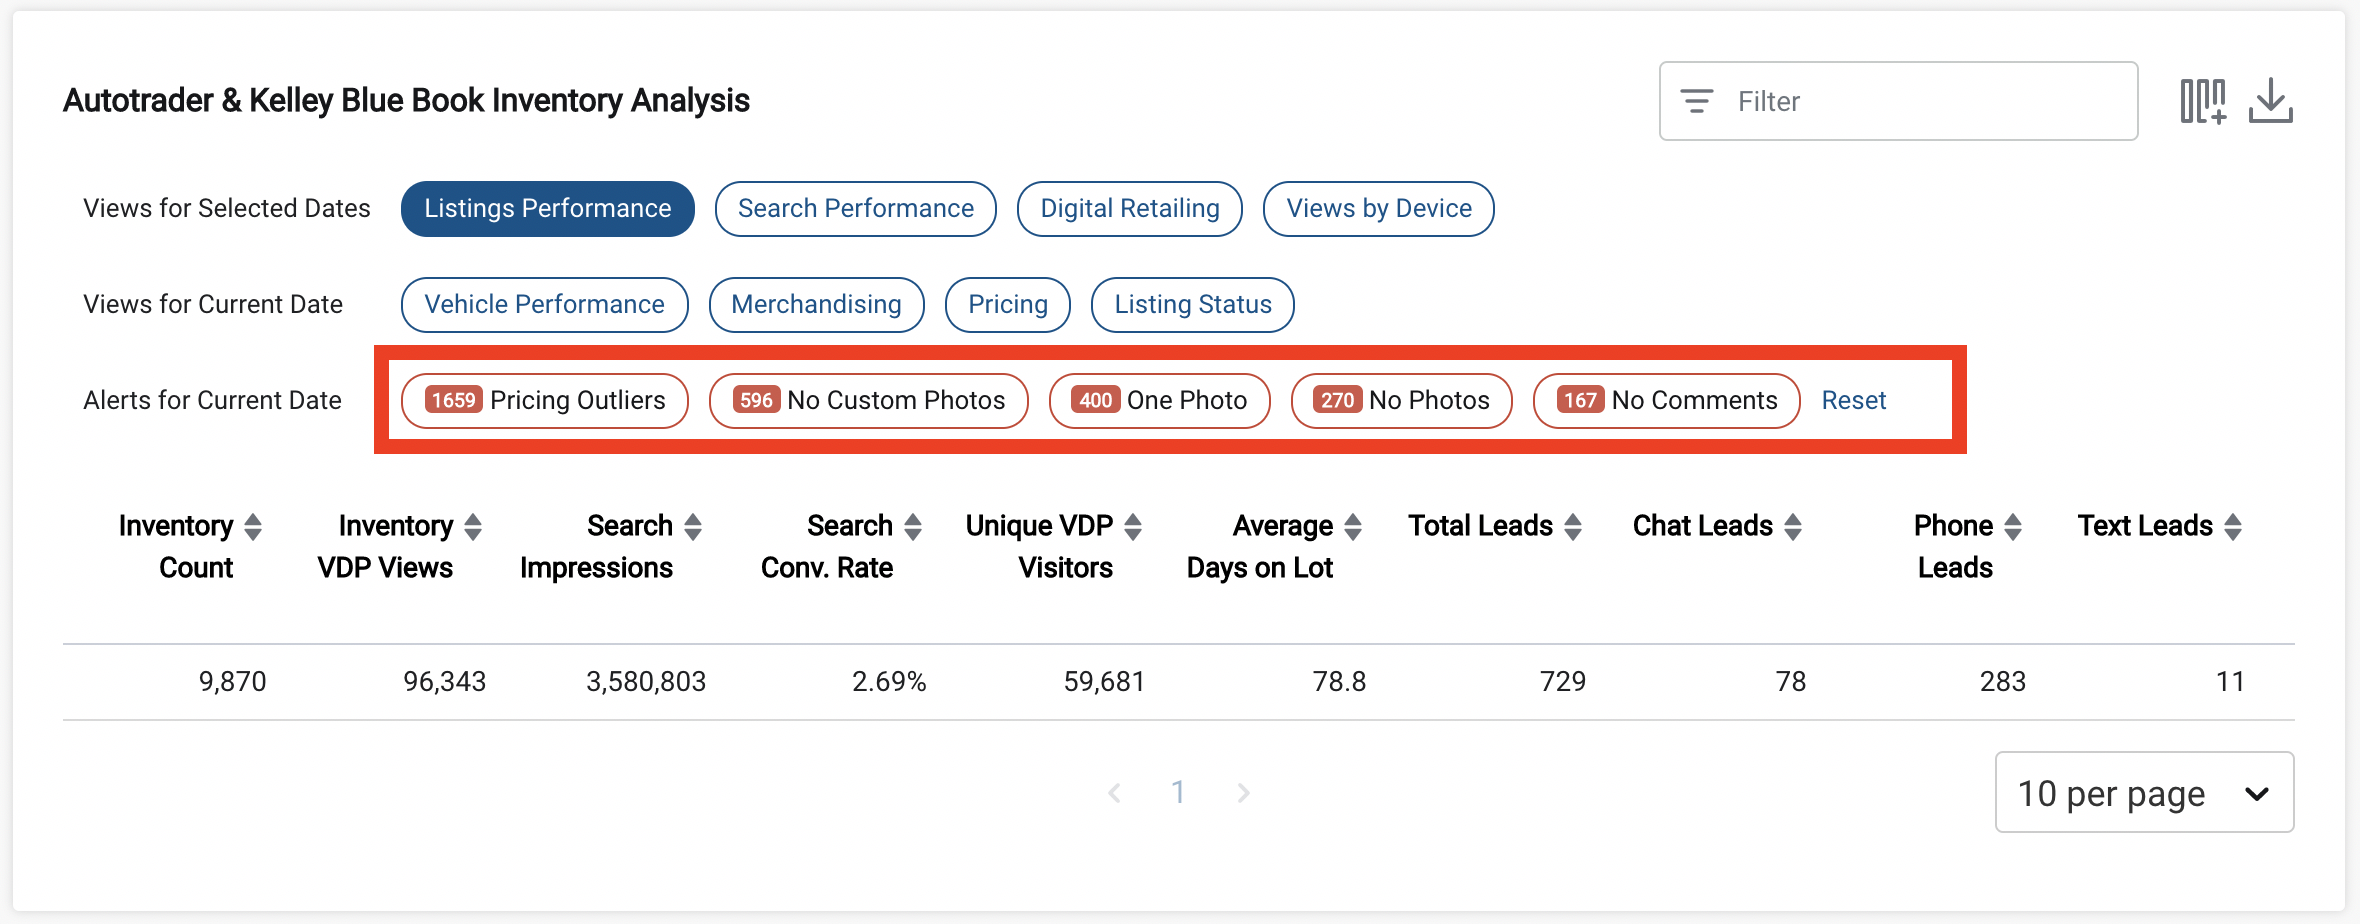
Alerts are the quickest way to see exactly what you can do to improve listing performance. If you scroll to the “Autotrader and Kelley Blue Book Inventory Analysis” section in the Analyze Inventory report, the numbers in red indicate where to take action through price adjustments or more complete vehicle information.
B: Begin updates
Using your alerts, take immediate action on the listings that require attention by adding information such as photos, videos, or comments, which are proven to increase shopper engagement. You can also ensure your pricing strategy is in line with the Kelley Blue Book Fair Market Range, which is conveniently located next to each VIN in the report.
C: Consider why
Beyond just making updates, look deeper into why these triggered the alerts in the first place. Things to consider are:
- Is the reconditioning process not keeping up?
- Do I have a problem in service?
- Is there a staffing issue that should be addressed?
- Are there issues with my data feed?
Now that you understand how to take immediate action within nVision, log in and take a look, following the A-B-C approach. Remember, if you don’t yet have access, contact your Dealer Success Consultant today. And keep an eye on our blog over the next few weeks. We’ll be providing other tips for effectively using this valuable platform.


